Learning Resources
If you are looking for help on ChartNexus®, ChartNexus XPertTraderTM or just technical analysis in general, you've come to the right place. Here are some of the resources that we offer:
| Video | User Manual | Articles |
| To help you get started quickly we have prepared a host of self paced videos for you. Click on each link to see how to do the most common actions in ChartNexus® and ChartNexus XPertTraderTM | In addition to videos we have prepared a manual to help you get the most out of ChartNexus® |
We have written articles for some of the most popular financial magazines in the region. This is a good place to get to know some of the principles of Technical Analysis. |
| Newsletters | Books | Technical Indicators |
| We send out newsletters regularly which contain snapshots of the indices; XPertTrader corner where we explain aspects related to XPertTrader and how you can maximize its usage; we also cover tidbits on Technical Analysis and many more topics. | Some things just feels better if you can hold them. Books are something we feel are still an important part of our quest for knowledge. Here are some of our recommendations. |
In this section you will learn some of the most common technical indicators that are used in charting stocks and futures. We will introduce you to the basic concepts of each and show you how it will look like in ChartNexus®. |
Videos
To help you get started quickly we have prepared a host of self paced videos for you. Click on each link to see how to do the most common actions in ChartNexus® and ChartNexus XPertTraderTM.

User Manual
In addition to videos we have prepared a manual to help you get the most out of ChartNexus®.
 |
ChartNexus Manual |
XPertTrader Manual |
Articles
We have written articles for some of the most popular financial magazines in the region. This is a good place to get to know some of the principles of Technical Analysis.
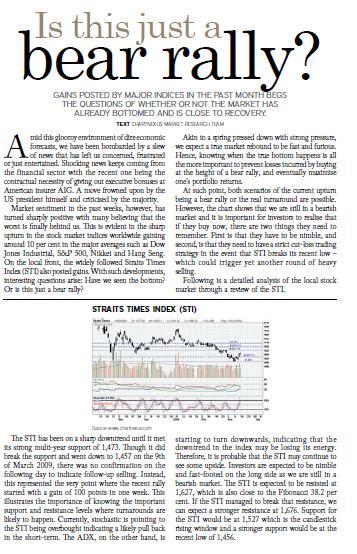 |
Is This Just A Bear Rally?Gains posted by major indices in the past month begs the questions of whether or not the market has already bottomed and is close to recovery. |
|
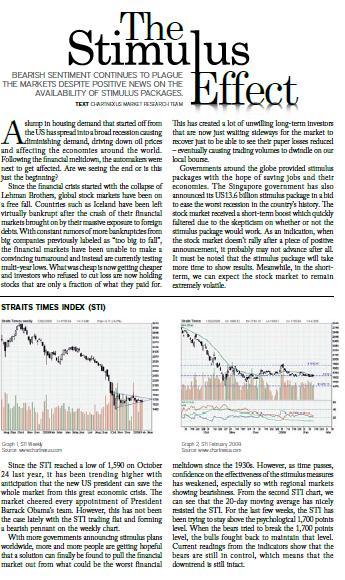 |
The Stimulus EffectBearish sentiment continues to plague the markets despite positive news on the availability of stimulus packages. |
|
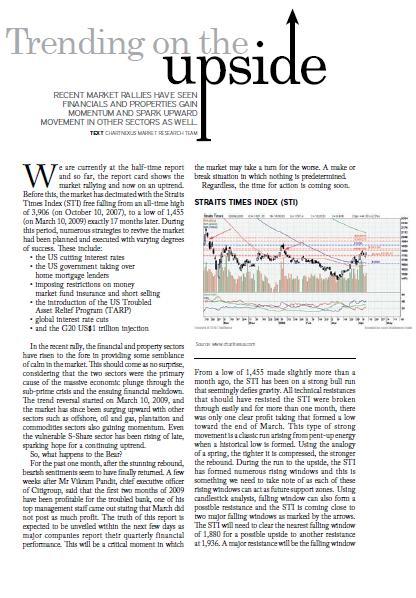 |
Trending On The UpsideRecent market rallies have seen financials and properties gain momentum and spark upward movement in other sectors as well. |
|
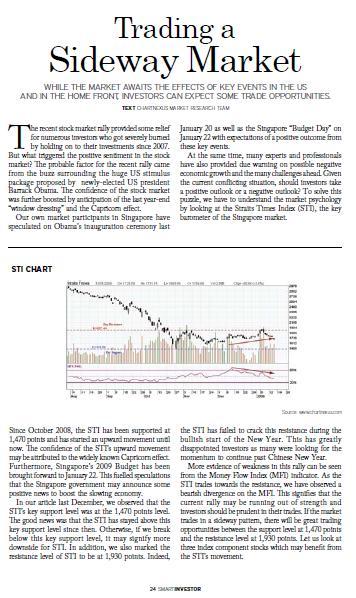 |
Trading A Sideway MarketWhile the market awaits the effects of key events in the US and in the home front, investors can expect some trade opportunities. |
|
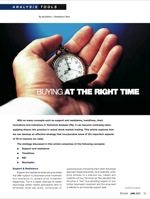 |
Buying at the right timeWith so many concepts such as support and resistance, trendlines, chart formations and indicators in Technical Analysis (TA), it can become confusing when applying theory into practice in actual stock market trading. This article explores how we can develop an effective strategy that incorporates some of the important aspects of TA to improve our odds.
|
|
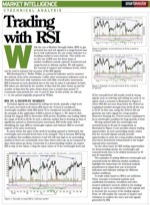 |
Trading with RSIWhile the use of Relative Strength Index (RSI) to get technical buy and sell signals in a range-bound mar- ket is well understood, the use of this indicator in a trending market is more intricate. This article covers the use of RSI over the three types of market conditions namely uptrend, downtrend and range-bound or sideway market. We will explore the concept of support and resistance levels, which can be used to enhance the accuracy of the RSI signals. RSI developed by J. Welles Wilder, is a powerful indicator used to measure the velocity of the price movements. Unlike other momentum indicators such as Stochastic that have wide variations even with little overall price movements, RSI is immune to such drawback due to the way its value is calculated. In brief, RSI values are affected by the number of days that the price closes up and the number of days that the price closes down over a certain time period. Commonly used periods for t are 14 and 21 days. In this article, we will use t = 14, the period originally proposed by Wilder.
|
|
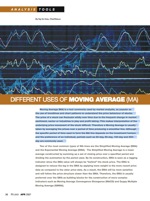 |
Different Uses of Moving AverageMoving Average (MA) is a tool commonly used by market analysts, as popular as the use of trendlines and chart patterns to understand the price behaviour of stocks. The price of a stock can fluctuate wildly over time due to the frequent change in market sentiment, sector or industries in play and profit taking. This makes interpretation of the underlying price movement of the stock difficult. Therefore a Moving Average is usually taken by averaging the prices over a period of time producing a smoother line. Although the specific period of time used to form the MA line depends on the investment horizon and the preference of an individual, periods such as 20-day, 50-day, 100-day and 200-day are commonly used.
|
|
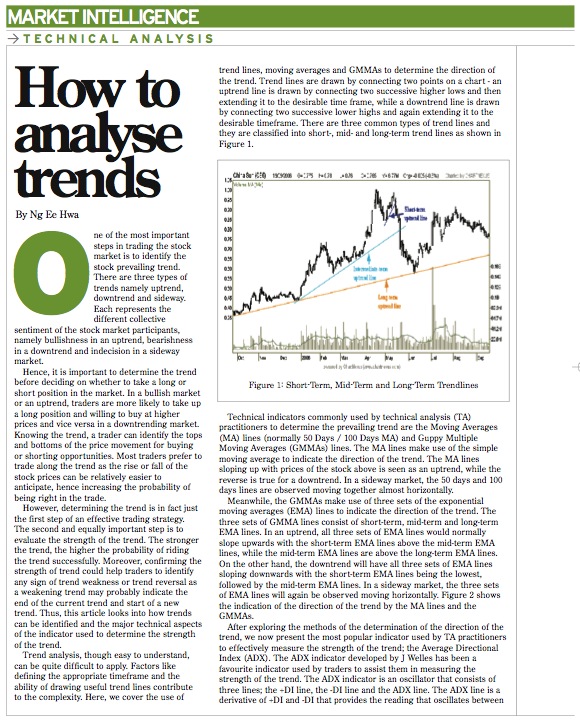 |
How to analyse trendsOne of the most important steps in trading the stock market is to identify the stock prevailing trend. There are three types of trends namely uptrend, downtrend and sideway. Each represents the different collective sentiment of the stock market participants, namely bullishness in an uptrend, bearishness in a downtrend and indecision in a sideway market.
|
|
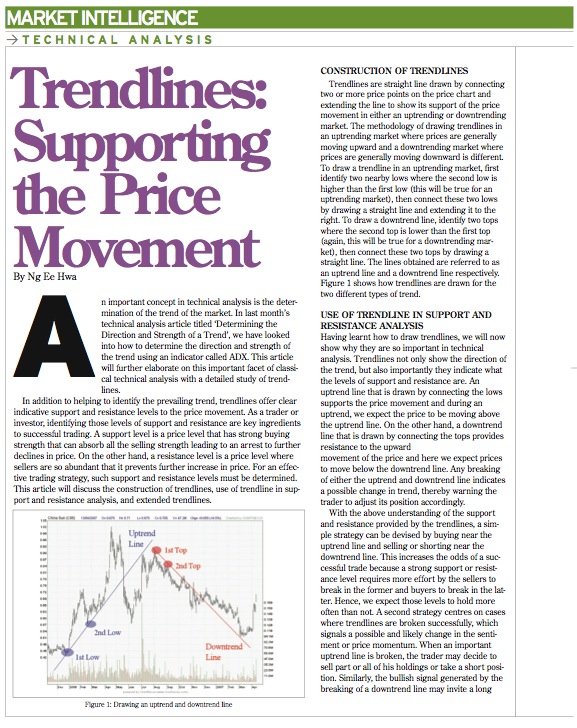 |
Trendlines: Supporting the Price MovementAn important concept in technical analysis is the determination of the trend of the market. This article will further elaborate on this important facet of classical technical analysis with a detailed study of trendlines.
|
|
 |
Trading Strategies Using StochasticIn the aftermath of the global market correction following the big drop in the Chinese stock market indices in Feb 2007, investors have returned to the markets with a vengeance pushing the indices to scale new heights almost daily. However with the recent moves by the Chinese authorities to coll the bullishness through measures such as the increase in stamp duties, the Chinese stock markets have again dropped significantly in the first few days of June 2007. This example of wild swings in the market sentiment can cause serious damage to the retail investor\s pocket, especially those uneducated in the forces at play in the stock market. Consequently it is vital that investors and traders are well-equipped in the technical analysis tools to time the market effectively. this article will look at one of the tools in the Technical Analysis indicators called Stocastic, a momentum indicator that shows clear bullish and bearish signals.
|
|
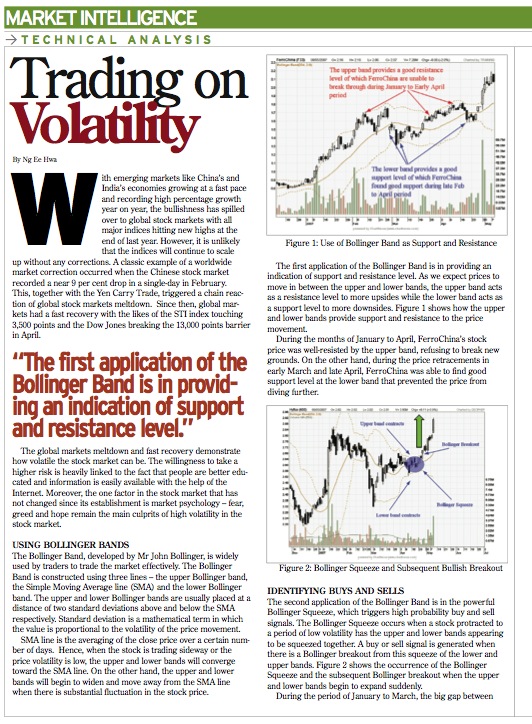 |
Trading on VolatilityWith emerging markets like China’s and India’s economies growing at a fast pace and recording high percentage growth year on year, the bullishness has spilled over to global stock markets with all major indices hitting new highs at the end of last year. However, it is unlikely that the indices will continue to scale up without any corrections. A classic example of a worldwide market correction occurred when the Chinese stock market recorded a near 9 per cent drop in a single-day in February. This, together with the Yen Carry Trade, triggered a chain reac- tion of global stock markets meltdown. Since then, global mar- kets had a fast recovery with the likes of the STI index touching 3,500 points and the Dow Jones breaking the 13,000 points barrier in April.
|
|
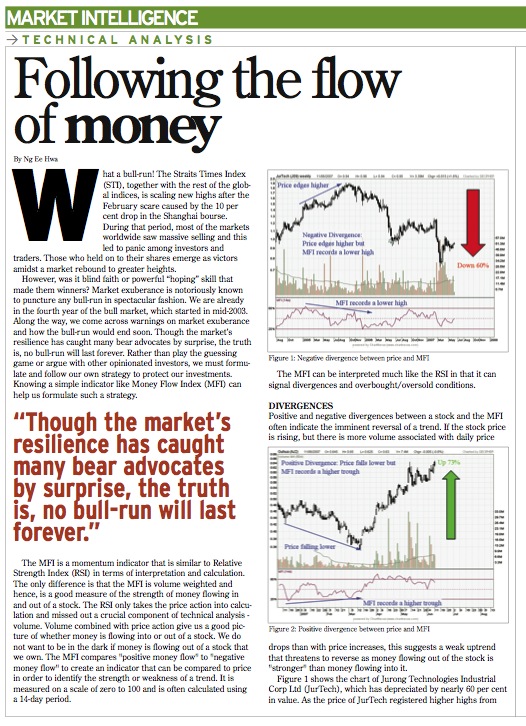 |
Following the flow of moneyWhat a bull-run! The Straits Times Index (STI), together with the rest of the global indices, is scaling new highs after the February scare caused by the 10 per cent drop in the Shanghai bourse. During that period, most of the markets worldwide saw massive selling and this led to panic among investors and traders. Those who held on to their shares emerge as victors amidst a market rebound to greater heights. However, was it blind faith or powerful 'hoping' skill that made them winners?
|
|
 |
Fibonacci Retracements � Waiting for the Right MomentIt has been 3 years since the Singapore stock market begun its amazing bull run, scaling to new highs and reaching the all time high of more than 3600 points in June 2007. The exponential increase in trading volume in the stock market shows that more and more beginners may be getting involved in stocks. Most are looking for big rewards and are determined to make a killing to profit from this bullish market. However largely unknown to beginners, the lack of a comprehensive trading strategy or technical knowledge in analyzing the behavior of the stock market is leaving them exposed to high risk...
|
|
 |
Swing Trading with Price PatternsPrice movements are sometimes predictable. They are predictable because human behaviour has never changed in the market place. The same factors such as hope, fear and greed exist in the market now and will still be around in the future. At every price rally, profit taking is expected. The fear of losing the unrealized profits prompted many investors to take their money off the trade. The same happens when the price plunges. Many investors assume they are looking at the lowest price only to realise the following saying is true, �the low goes lower� as many ...
|
|
 |
Using Continuation Patterns for Breakout TradingIn the last issue we shared how to trade short-term price patterns. In this article we will share another form of price patterns known as the triangles or continuation patterns where price is expected to breakout after consolidations. They are also well-known as intermediate or near term patterns. Although they are essentially continuation patterns, they sometimes act as reversal patterns as well. Let's begin our discussion with an introduction to ascending triangles.
|
|
 |
Illuminate Your Trading with Candlestick ChartsCandlesticks charts are a favourite of many traders for the amount and variety of information that can be captured within its price patterns. Ng Ee Hwa explains the basics of candlesticks with two common chart patterns that are often observed...
|
|
 |
Bottom-fishing, anyone?It has been more than five months since the sharp downtrend in the regional market started. During this period, our widely followed local index Straits Times Index(STI) has corrected by more than 30% from the all-time high of 3909 achieved on 10th October 2007. To make matters worse for the small investors, many of the popular stocks have fared much worse than the benchmark index. Cosco Corp, the star performer of 2007 has already corrected by a hefty 60%. There are many other S-shares (SGX-listed China stocks) which have similarly suffered such a brutal fate in this bear market. With this severe correction, investors may be tempted to look at buying some stocks considering how low their prices are, compared to their highs achieved just a few months ago also commonly known as bottom-fishing.
|
|
 |
Low Confidence Drags Markets Down (Page 1)In last month’s article, we investigated the impact of the Lehman Brothers fallout and how the negative sentiment would have aff ected the local bourse. Since then, stock markets around the world have plunged in a free-fall style. Many investors have lost both money and confidence ...
|
|
 |
Low Confidence Drags Markets Down (page 2)Yanlord, along with many of the other S-shares, has fallen sharply from its peaks. Many of these S-shares have been mercilessly sold down to ...
|
|
 |
Untangling the bearish market psychology (Page 1)The recent meltdown in the stock markets has hit hard those investors who refuse to sell on the premise that the price is lower than the value of the company. What they were holding at $2 has theoretically become more valuable at $1 but nevertheless ...
|
|
 |
Untangling the bearish market psychology (Page 2)Sino-environment is currently trading at a support turned resistance level at around $0.755. Th e next support level may be at around $0.385 which ...
|
|
 |
Elder’s Triple Screen Rule for ChartNexus XPertTraderThis document explains to you how to obtain a copy of ChartNexus software and subscribe to Elder’s Triple Screen Rule for ChartNexus XPertTrader. |
|

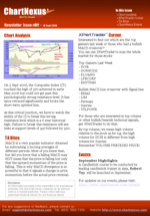
Newsletters
We send out newsletters regularly which contain snapshots of the indices; XPertTrader corner where we explain aspects related to XPertTrader and how you can maximize its usage; we also cover tidbits on Technical Analysis and many more topics.
All users are automatically signed up for it. If you do not wish to receive it, please contact us.
 |
Singapore Edition | Malaysia Edition |
Books
Some things just feels better if you can hold them. Books are something we feel are still an important part of our quest for knowledge. Here are some of our recommendations.
 |
Technical Analysis of the Financial Markets: A Comprehensive Guide to Trading Methods and Applications Author : John J. Murphy Description Our favourite book for technical analysis. We think that beginners or advanced users will find this book useful. This is definitely the definitive guide for anyone who is interested in technical analysis. It covers technical tools, indicators and show many examples with figures. Though the title is for meant for futures markets, but you still use it for stocks. It teaches you how to read and intepret charts and understand the indicators. A must-have if you're into technical analysis. |
|
 |
Technical Analysis of the Financial Markets: A Comprehensive Guide to Trading Methods and Applications Author : Larry Williams Description This is not a beginner's book. It contains research of stock market prices as early as 1854. In this book, the author shows and explains how you can identify market bottom and ride the upswing. This book also covers how to find a good stock, introduces to you some of the common market patterns, sheds light on the correlation between seasonality and stock prices and many other important and interesting topics. |
|
 |
Trend Trading - A Seven Step Approach For Success Author : Daryl Guppy Description Recommended book by Daryl Guppy, especially if you want to learn more in-depth knowledge about the popular Guppy Multiple Moving Average (GMMA). The book also covers on how to find suitable trading opportunities, how to select your best trade, setting stop losses and more. |
|
Technical Indicators
In this section you will learn some of the most common technical indicators that are used in charting stocks and futures. We will introduce you to the basic concepts of each and show you how it will look like in ChartNexus®.