Momentum
Overview
Momentum measures the rate of the rise or fall in stock prices. It measures the amount that a security's price has changed over a given time span (Achelis 1995). From the standpoint of trending, momentum is a very useful indicator of prices' strength or weakness. History has shown us that momentum is far more useful during rising markets than during falling markets. In other words, bull markets tend to last longer than bear markets.
How it is calculated
Momentum indicator is the ratio of today's price compared to the price n-periods ago.

How to interpret
The interpretation of Momentum indicator is similar to the interpretation of the Price Rate of Change (ROC). While both indicators display the rate of change of a security's price, ROC displays the rate of change as a percentage, whereas Momentum indicator displays the rate of change as a ratio.
Trend Follower
Buy when the indicator bottoms and turns up, and sell when the indicators peaks and turns down (Achelis 1995).
If Momentum indicator reaches extremely high or low values (relative to its historical values), there may be a continuation of the current trend. For example, if the Momentum indicator reaches extremely high values and then turns down, you should assume that process will probably go still higher. In either case, trade only after price confirms the signal generated by the Momentum indicator.
Divergence
A bullish divergence occurs when price makes a low, then corrects moving higher, and subsequently, reaches a lower low. At the same time, Momentum indicator makes a low followed by a higher low.
A bearish divergence occurs when price makes a high, then corrects moving lower, and subsequently, reaches a higher high. At the same time, Momentum indicator makes a high followed by a lower high.
Trend Reversal
Normally, a reversal in the momentum trend acts as confirming evidence of a price trend reverse signal. In effect, this momentum signal performs the act of supplementary "witness" in our weight of the evidence approach. The actual buy and sell signals can only come from a reversal in trend of the actual price, not the momentum series (Pring 2002).
Example
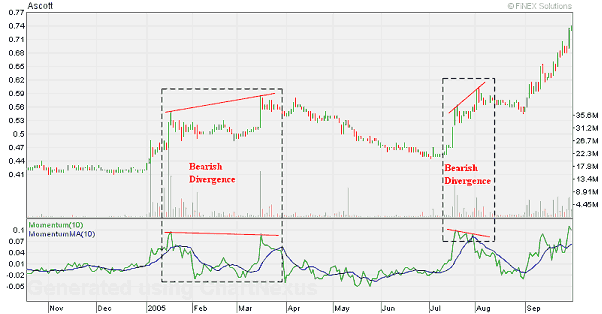
We purposely choose the same example for ROC and Momentum to show the similarity of the two indicators. Investors can choose to use either one.

In the above chart, Ascott displayed two bearish divergence: while prices were making a higher high, Momentum indicator formed a lower high. The first divergence led to declining prices for almost three months; whereas the second divergence resulted in short-term price weaknesses.
BUY Signal
- The indicator bottoms
- The indicator bottoms and turns up
- The indicator reaches extremely high values (relative to its historical values) and then turns down
- Positive divergence
- The indicator reverses its downtrend and is trending up
- The indicator is crossing up the 0 level
SELL Signal
- The indicators peaks
- The indicators peaks and turns down
- The indicator reaches extremely low values (relative to its historical values) and then turns up
- Negative divergence
- The indicator reverses its uptrend and is trending down
- The indicator is crossing down the 0 level
References :
- Achelis, S. B., Technical Analysis from A to Z, 1995
- Pring, M. Technical Analysis Explained, 2002
