Bollinger bands
Overview
A useful addition to Moving Average (MA) Envelope analysis is a new approach devised by John Bollinger. Bollinger Bands is an indicator that allows users to compare volatility and relative price levels over a period time.
Bollinger Bands addresses the limitation of MA Envelope by incorporating the security price volatility. Rather than being plotted as fixed percentage above and below an MA, Bollinger Bands are calculated as standard deviations above and below an average based on closing prices. They are designed with the concept that Bollinger Bands contracts when volatility is low and expands when volatility is high.
How it is calculated
Bollinger Bands consists of 3 curves designed to encompass the majority of a security's price action. A good starting point for most things financial is a 20-day MA (Bollinger 2001). A bandwidth of 2 standard deviations provides an equally good starting point (Bollinger 2001).
- Middle band = 20-day Moving Average (MA)
- Upper band = Middle band + 2 standard deviations
- Lower band = Middle band - 2 standard deviations
Standard deviation provides a good indication of volatility. Using the standard deviation ensures that the bands will react quickly to price movements and reflect periods of high and low volatility. Sharp price increases or decreases, and hence volatility, will lead to a widening of the bands.
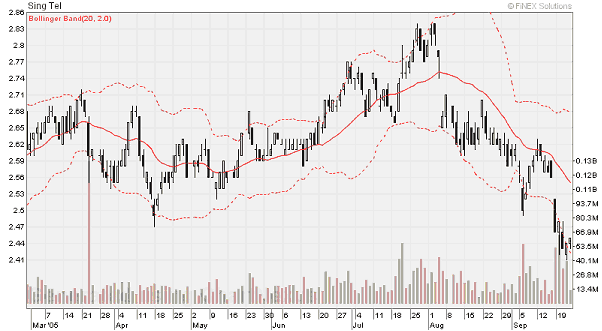
The chart below shows how Bollinger Bands looks like.

Time Frame
Some securities require longer or shorter time periods than 20-day. The best way to identify the correct MA is to look for MA that provides support to reactions, especially the first reaction after a change in trend. Suppose the market makes a low, rallies for 10 days, and then pulls back for 5 days before turning higher again and confirming the birth of the new uptrend by taking out the high for the initial 10-day rally. The correct MA would be the one that offered support at the low of the 5-day pullback.
However, as the adaptivity of Bollinger Bands comes primarily from volatility and not from MA length-selection, it turns out that as you vary the length of the MA, you also need to vary the number of standard deviations used to plot the bands. The idea is to capture information from the dominant volatility cycle for the bandwidth while using the best measure of trend for the midpoint. Below are John Bollinger's (2001) recommended width parameters for Bollinger Bands:

How to interpret
Tendency for sharp price change
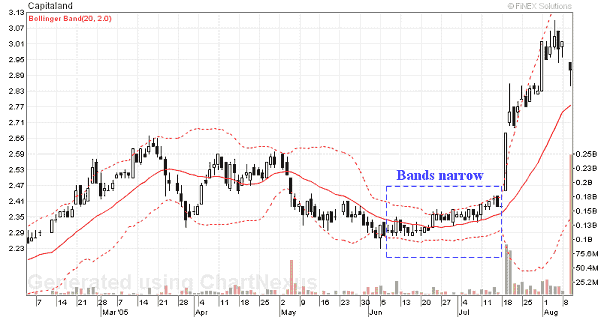
When the bands narrow, there is a tendency for sharp price changes to follow (Pring 2002). This, of course, is another way of saying that when prices trade in a narrow range and lose volatility, demand and supply are in a fine state of balance. In this context, narrowing of the band is always relative to the recent past, and that is where Bollinger Bands can help in visually showing the narrowing process. They also give us some indication of when a breakout might materialize because they start to diverge once the price begins to take off (see the following chart example).

Double bottoms buy
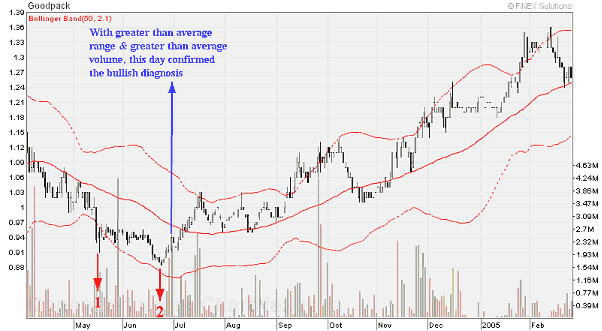
Double bottoms formation is the most common bullish transition type, although it is not the only one (Bollinger 2001). Usually the first low will either be in contact with the lower band or be outside the lower band. The reaction rally will carry price back inside Bollinger Bands, often tagging or exceeding the middle band in doing so. Then, the subsequent retest will occur inside the lower band. Either low can be higher or lower than the other. The important thing is that the second low occurs at or above the lower band.
A stock does not have to trade beneath the lower band at the first place. Price can be nearing, but not touching the lower band on the initial low, then trading only halfway between the lower band and the middle band on the retest. Wait for a rally day with greater than average range and greater than average volume to confirm the bullish diagnosis, and then buy (Bollinger 2001).
Let's take a look at the following example.

From mid of May till end of June 2004, Goodpack formed double bottoms. While the first bottom occurred beneath the lower band, the second low occurred within the lower band. On its way up after the second low, on 30 June 2005, the stock was traded with a greater than average range and a greater than average volume. This confirmed the bullish diagnosis.
Triple tops sells
Tops are quite different from bottoms. Speed, volatility, volume, and definition-all are apt to be different. Far more common are double tops. Most common of all, however, is the triple tops, and a common variation of this is the head-and-shoulder tops (Bollinger 2001).
The classic pattern would be a left shoulder outside the upper Bollinger Band, a head that tagged the upper band, and a right shoulder that failed well short of the upper band (Bollinger 2001). In an ideal world, the neckline would coincide with the middle band at the right shoulder, and the first decline would stop at the lower band. The throwback rally would stop at the middle band, and finally, dramatically, the first leg down would break the lower band. That is the ideal, but the odds of seeing such a pattern, perfect in every respect, are not high. Much more common would be a pattern that obeyed most of those rules, offering general guidance as the pattern unfolded.
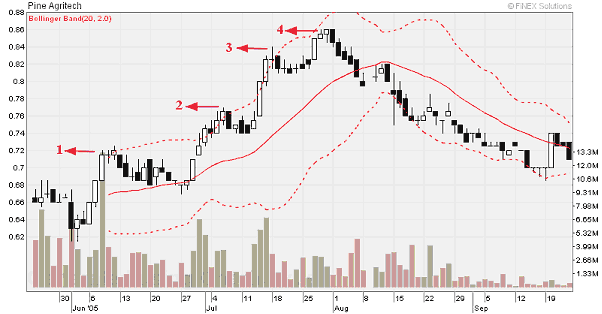
A very common variation of triple tops is three pushes to a high (Bollinger 2001). This pattern often develops as the leading edge of larger, longer top formations. Typically the first push will be outside the upper band, and the second push will make a new high and touch the upper band. The third push may make a marginal new high-more often not-but will fail to tag the band. Volume will diminish steadily across the pattern. This is a portrait of failing momentum.
Let's take a look at the following example.

Pine Agritech displayed four pushes to a high. The first, second, and third highs were outside the upper band. Thus, these first three highs were not a valid triple tops sell. The fourth high, however, failed to tag the upper band, which confirmed a triple tops sell (2-3-4). Notice that volume diminished steadily across the patterns.
Rules available in ChartNexus
Bollinger Bands - Price Below/Above The Lower/Upper Band
- Price is below lower band
- Price is above upper band
Parameters available:
- Period - period of the moving average line from where the bands are distanced apart
- Std Deviation - lower and upper bands will be distanced at the value of the Std Deviation from the MA line
Bollinger Bands - Price Just Touching/Crossing Band
- Price just touches or crosses lower band
- Price just touches or crosses upper band
Parameters available:
- Period - period of the moving average line from where the bands are distanced apart
- Std Deviation - lower and upper bands will be distanced at the value of the Std Deviation from the MA line
Bollinger Bands - Price Touched Band And Rebounded/Retreated From Band
- Price rebounds from lower band
- Price retreats from upper band
Parameters available:
- Period - period of the moving average line from where the bands are distanced apart
- Std Deviation - lower and upper bands will be distanced at the value of the Std Deviation from the MA line
- x - the amount that price rebounds/retreats from band)
- x Margin - If value set to '1' means price rebounded/retreated from band within x +/- 1)
- t - the maximum number of days that price rebounded/retreated
Buy signal
- Price is either in contact with the lower band or outside the lower band, move back inside BB (either tagging or exceeding the middle band), then move lower either in contact with the lower band or inside the lower band
- Price is near the lower band, but not touching the lower band, move back inside BB (either tagging or exceeding the middle band), then move lower halfway between the lower band and the middle band on the retest
Sell signal
- Price move outside the upper band, move back within upper and mid bands, then make a new high which touches the upper band, move back within upper and mid bands, then either make a marginal new high or not making a new high which fails to tag the upper band
- A high made outside the bands, move back within upper and mid bands, then make a new high which fails to tag the upper band
References :
- Bollinger, J., Bollinger on Bollinger Bands, 2001
- Pring, M. J., Technical Analysis Explained, 2002
