Chaikin Money Flow (CMF)
Overview
Developed by Marc Chaikin, the Chaikin Money Flow oscillator (CMF) is an MA oscillator based on the Accumulation/Distribution indicator (Achelis 1995). CMF is developed based on the principle that rising prices should be accompanied by expanding volume (Pring 2002).
How it is calculated
The formula for CMF is:

The formula emphasized the fact that market strength is usually accompanied by prices closing in the upper half of their daily range with increasing volume. Likewise, market weakness is usually accompanied by prices closing in the lower half of their daily range with increasing volume (Pring 2002).
The number of periods can be changed to best suit a particular stock. The 21-day CMF (i.e. CMF for one month) is a good representation of the buying and selling pressure for the past month. The longer the period, the more deliberate the swings (Pring 2002).
How to interpret
Buying/Selling Pressure
When CMF is greater than zero, it indicates a buying pressure. In contrast, when CMF is lesser than zero, it indicates a selling pressure. The longer the CMF remains above/below zero, the more evidence that the sentiment is bullish/bearish. Moreover, the more positive/negative the reading is, the more is the evidence of buying/selling pressure (see the following example).
When Cosco rallied to a higher high on 5 September 2005, CMF was relatively less positive than the CMF on its previous high. Though CMF had generally remained above zero for an extended period of time, this signaled weak buying. Notice the sideways price movements that follow.
Divergence Analysis
Divergences are not uncommon in momentum indicators. What sets CMF indicator apart from the rest is that the divergences are usually far more blatant than say, Relative Strength Index (RSI) or Rate of Change (ROC). As a result, it can provide clues of probable trend reversals that may not be apparent elsewhere. Of course, as always, we need to witness some kind of trend reversal in price to confirm the clue (Pring 2002).
Let us take a look at the following example:
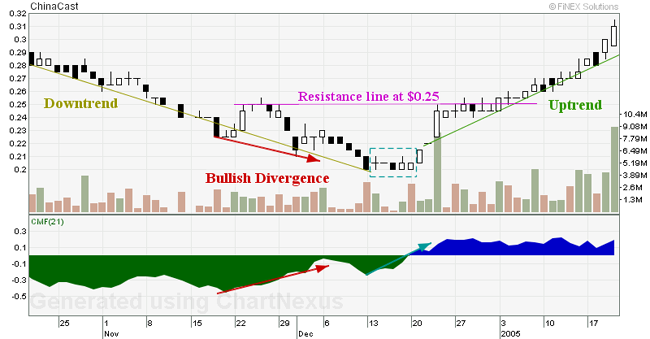
The above chart of ChinaCast shows a bullish divergence following a downtrend. See how the price made a marginal new low, but CMF was rising. Subsequently, prices were still moving lower before experiencing a sideways trading range for about one trading week. During the sideways trading, CMF was continuously rising; thus suggesting that the sideways pattern would be resolved in a positive way. Although prices rallied up upon escaping from the range-bound, a cautious investor would wait until price successfully broke the $0.25 resistance line before jumping to the bandwagon.
Rules available in ChartNexus
CMF Crossing Zero
- CMF crosses above centerline
- CMF crosses below centerline
Parameters available:
- Period - period used for calculation of CMF
- x - the distance that price travelled above/below zero
CMF Sustained Pressure
- CMF above centerline for a long time
- CMF below centerline for a long time
Parameters available:
- Period - period used for calculation of CMF
- x - the distance that price travelled above/below zero
- t - the minimum number of days for CMF to stay above/below zero
CMF Divergence With Price
- CMF is increasing with price still moving down
- CMF is decreasing with price still moving up
Parameters available:
- Max Divergence Days - the maximum number of days during which the divergence occurs
- Min Divergence Days - the minimum number of days during which the divergence occurs
- Min Overlap Length - the minimum number of overlapping days during which price and CMF diverge
- Price Slope - the minimum slope of the moving average of the price
- CMF Slope - the minimum slope of the moving average of CMF
- Price MA Period - the number of days used for the period of the moving average of the price
- CMF MA Period - the number of days used for the period of the moving average of the CMF
- CMF On Right - if value is set to YES, only divergences with CMF slope on the right side of price slope are triggered
CMF Convergence With Price
- CMF is increasing with price moving up
- CMF is decreasing with price moving down
Parameters available:
- Max Convergence Days - the maximum number of days during which the convergence occurs
- Min Convergence Days - the minimum number of days during which the convergence occurs
- Min Overlap Length - the minimum number of overlapping days during which price and CMF converge
- Price Slope - the minimum slope of the moving average of the price
- CMF Slope - the minimum slope of the moving average of CMF
- Price MA Period - the number of days used for the period of the moving average of the price
- CMF MA Period - the number of days used for the period of the moving average of the CMF
- CMF On Right - if value is set to YES, only convergences with CMF slope on the right side of price slope are triggered
CMF Trend
- CMF is trending upwards
- CMF is trending downwards
Parameters available:
- t - the number of days that CMF has been trending
- Slope - the slope of the CMF when it is trending
References :
- Achelis, S. B., Technical Analysis from A to Z, 1995
- Pring, M. J., Technical Analysis Explained, 2002