Relative Strength Index (RSI)
Overview
Relative Strength Index (RSI) is a price momentum indicator introduced in 1978 by J. Welles Wilder. RSI measures the velocity at which prices are moving (Meyers 1994).
RSI was intentionally designed to address the erratic movement flaw often associated with momentum indicator (Pring 2002). For example, if one has a 20-day oscillator and 20 days ago the price moved up or down dramatically, the current reading will be a misleading low or high reading. The RSI formula attempts to smooth out such distortions.
How it is calculated
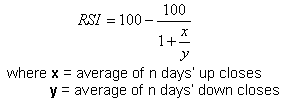
RSI compares the days that the price of a security ends higher with those days where the price ends lower for a specified period of time. It is modeled simply by the following equation:

Timespan
Wilder (1978) suggests the use of 14 days of data in the RSI calculation on the basis that it is half of the 28-day lunar cycle (Pring 2002). This produces a smooth and sensitive oscillator for medium term trading. If an investor is looking at a very short-term basis, a shorter term RSI (9 days) can be used to produce more responsive signals--although the oscillator swings will be more pronounced.
In general, the greater the number of time periods is used, the more stable the RSI is, and the fewer signals are generated. Short-term RSI tends to produce more signals than longer-term RSI, including more false signals (Meyers 1994). Nevertheless, shorter-term time spans are more suitable for pointing out overbought and oversold conditions; whereas longer-term spans lend themselves better to the purpose of constructing trendlines and price patterns (Pring 2002).
How to interpret
Overbought And Oversold
Wilder (1978) recommends using levels of 70 and 30 to indicate overbought and oversold respectively. Generally, if RSI falls below 70, it is a bearish signal. Conversely, if RSI rises above 30, it is a bullish signal.
However as a momentum indicator, RSI is expected to trend at high values in a bullish market and at low values during a bearish market. Therefore in a bullish or bearish market, a better level for an overbought or oversold signal is 80 and 20 respectively.
Moreover, we should remember that the longer the time span, the narrower the RSI overbought and oversold lines should be constructed and vice versa. Consequently, the 70/30 combination is inappropriate when the time span differs appreciably in either direction from the standard 14-day period. For instance, an 80/20 combination may give a much better feel for the overbought/oversold extreme than the 70/30 default value for a 9-day RSI. This is due to the fact that shorter time spans result in wider RSI oscillations. In contrast, due to the shallower swings, a 65/35 combination may give a much better feel for the overbought/oversold extreme than the 70/30 default value for a 65-day RSI.
Some traders identify the long-term bullish trend and then use oversold readings for entry points. The rationale is that if a downside breakout takes place in a bull trends (contra-trend manner), it is not likely to hold because RSI does not have much potential to remain oversold (Pring 2004). In other words, if the long-term trend is bullish, then oversold readings could mark potential entry points. However, since it reverses on a dime, investor would have had to be extremely nimble to make much of a profit. A protective stop should have been placed above the point where the probabilities favored the pattern is no longer having any downside influence on the price. This is because contra-trend breakouts do not always result in whipsaws.
TIPS #1 : A simple but effective method of interpreting RSI is to buy on crossing up through the 50 level and sell on the crossing down through the 50 level (Meyers 1994)
TIPS #2 : To isolate major buy candidates, remember that the best opportunities lie where long-term momentum, such as a 12-month RSI, is oversold. If you can also identify an intermediate- and a short-term oversold conditions, all three trends (primary, intermediate-term, and short-term) are then in a classic conjunction to give a high probability buy signal (Pring 2002).
NOTE : An overbought/oversold reading merely indicates that, in terms of probabilities, a counterreaction is overdone or overdue. It represents an opportunity to consider liquidation or acquisition, but NOT an actual buy or sell signal. This can come ONLY when the price series itself gives a trend-reversal signal (Pring 2002)
Divergence
Divergence between prices and RSI suggests that prices will be reversing. If prices are rising or flat and RSI is decreasing (negative divergence), look for a turn downward in process. On the other hand, if prices are declining or flat and RSI is increasing (positive divergence), expect prices to turn and move higher.
Divergences that occur after an overbought or oversold reading usually provide more reliable signals.
Failure Swings
Failure swings can also be used in the interpretation of RSI. A top failure swing occurs when RSI rises above 70, declines to a lower level, rises again failing to reach the 70 level, and then falls below the prior lower level. One would sell at that point. A bottom failure swing occurs when RSI falls below 30, rises to a higher level, falls again failing to reach the 30 level, and then rises below the prior higher level. One would buy at that point (Meyers 1994).
Example

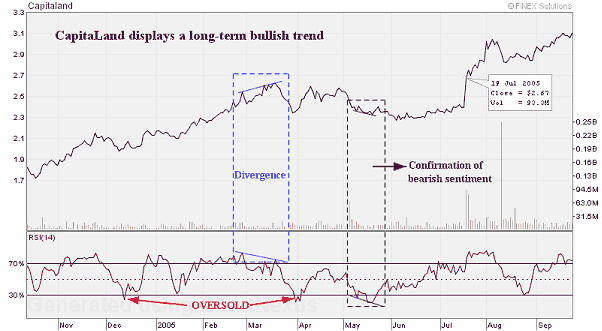
CapitaLand has been displaying an uptrend since mid of May 2004. From the above chart, there were two times when CapitaLand showed downside breakouts during its bullish trend. The first one was on mid of December 2004, and was accompanied by a negative divergence (i.e. when prices reached higher highs, RSI showed lower highs). Considering that CapitaLand had been displaying a bullish trend for six months at the time when the downside breakout occurred, this could be a good entry point.
The second downside breakout was on end of March till early April 2005. Prior to the downside breakout, a negative divergence occurred. If a short trade had been initiated in the breakout, a protective stop should have been placed.
On May 2005, RSI confirmed a bearish sentiment towards CapitaLand. From the chart, following this sentiment, prices moved sideways. Applying the tips to buy when RSI crossed up the 50 level would only be a wise decision if the other indicators signaled a comeback. As shown in the chart, after sideways price movements for more than 2 months, CapitaLand fought back hard (as indicated by the drastic increase in volume) to resume its uptrend line.
Buy signal
- Confirmation: price makes a high, then corrects moving lower, & subsequently reaches a higher high. At the same time, RSI makes a high followed by a higher high.
Sell signal
- Confirmation: price makes a low, then corrects moving higher, & subsequently reaches a lower low. At the same time, RSI makes a low followed by a lower low.
References :
- Meyers, T. A., The Technical Analysis Course: A Winning Program for Investors and Traders, 1994
- Achelis, S. B., Technical Analysis from A to Z, 1995
- Pring, M. J., Technical Analysis Explained, 2002
- Wilder, J. W., New Concepts in Technical Trading Systems, 1978
