Home Events Software Company Trainers Solutions Corporate Solutions Investor Relations

On Balance Volume (OBV)

Overview

The importance of volume is often overlooked in the study of technical analysis. However for many analysts, volume is considered as important if not more important than the price movement. Joseph Granville is such an analyst who believes that volume is the cause and price is the effect. This belief led to the development of the On Balance Volume (OBV), which is an indicator that measures the flow of volume in and out of a security.


How it is calculated

OBV is calculated in two steps. First, each day's total volume is deemed as being positive or negative depending on whether prices closed higher or lower for the day. If prices closed higher, the total volume is positive; and vice versa. Second, each day's positive or negative volume is summed in a running cumulative total (Meyers 1994).


How to interpret

Buying and Selling Pressure

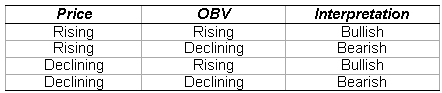
The actual value of OBV is not important. Its direction relative to price provides clues to buying and selling pressures. OBV is interpreted as follows:


Example

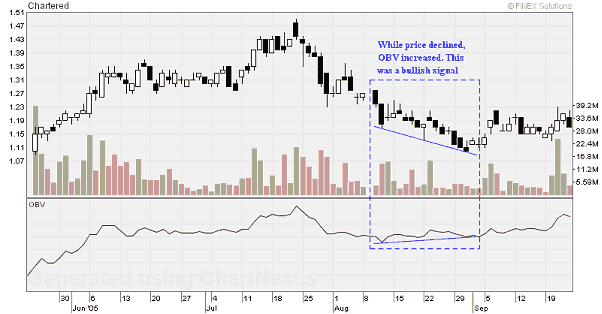
From the above chart of Chartered Semiconductor, notice that on August 2005, while price were declining, OBV were increasing. This signaled a bullish sentiment. It was observed from the chart that the price then went up and traded sideways.

Rules available in ChartNexus

OBV Divergence With Price
  • OBV is increasing with price still moving down
  • OBV is decreasing with price still moving up
Parameters available:
  • Max Divergence Days - the maximum number of days during which the divergence occurs
  • Min Divergence Days - the minimum number of days during which the divergence occurs
  • Min Overlap Length - the minimum number of overlapping days during which price and OBV diverge
  • Price Slope - the minimum slope of the moving average of the price
  • OBV Slope - the minimum slope of the moving average of OBV
  • Price MA Period - the number of days used for the period of the moving average of the price
  • OBV MA Period - the number of days used for the period of the moving average of the OBV
  • OBV On Right - if value is set to YES , only divergences with OBV slope on the right side of price slope are triggered
  • OBV Convergence With Price
    • OBV is increasing with price moving up
    • OBV is decreasing with price moving down
    Parameters available:
  • Max Convergence Days - the maximum number of days during which the convergence occurs
  • Min Convergence Days - the minimum number of days during which the convergence occurs
  • Min Overlap Length - the minimum number of overlapping days during which price and OBV converge
  • Price Slope - the minimum slope of the moving average of the price
  • OBV Slope - the minimum slope of the moving average of OBV
  • Price MA Period - the number of days used for the period of the moving average of the price
  • OBV MA Period - the number of days used for the period of the moving average of the OBV
  • OBV On Right - if value is set to YES , only convergences with OBV slope on the right side of price slope are triggered
  • OBV Trend
    • OBV is trending upwards
    • OBV is trending downwards
    Parameters available:
  • t - the number of days that OBV has been trending
  • Slope -the slope of the OBV when it is trending
  • References :

    • Meyers, T. A., The Technical Analysis Course: A Winning Program for Investors and Traders, 1994
    You are currently browsing : Home >> Education >> Technicals


    Corporate Partners  
    Corporate Partners