Moving Average (MA)
Overview
Due to traders' frequent change of sentiment, positional plays and profit taking, the price of a security swings wildly over time. This results in a sometimes-difficult interpretation of the actual price trend of the security. Moving Average (MA) attempts to tone down the fluctuations of stock prices into a smoothed trend - without compromising the overall direction of the price movement-so that distortions are reduced to a minimum. Four MA are used in the technical analysis: simple, weighted, exponential, dual, and Guppy Multiple MA (GMMA). Another important MA is MA Envelopes.
How it is calculated
Simple MA
Simple MA is a mean average, which is constructed by totaling a set of closing prices and dividing that total by the number of observations (Pring 1985). A 20-day simple MA is calculated by:
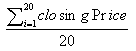
In order to get the average to "move", a new closing price is added (in this example, the closing price of day 21) and the first closing price on the list is subtracted. The new total is then divided by 20 and the process repeats perpetually.
Weighted MA
Weighted MA aims to improve the possible drawback of simple MA by giving more weight to prices from the most recent observations. There are almost limitless ways in which the data can be weighted. The most common method to calculate a 20-day weighted MA, for instance, is:
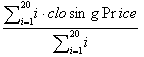
Another method is to calculate a simple MA but in doing so to use the most recent observation twice, thereby doubling its weight (Pring 1985).
Exponential MA
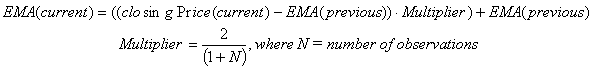
An exponential MA is a shortcut to obtain a form of weighted MA, since an exponential smoothing also gives greater weight to more recent data. In order to construct 20-day exponential MA, for example, the following formula is followed:
Dual MA
Dual MA basically plots one short-term simple MA side-by-side with another longer-term simple MA, for example, a 12-day MA and a 26-day MA (see chart below). This procedure has the advantage of smoothing the data twice and thereby, reducing the possibility of a whipsaw.
Guppy Multiple MA (GMMA)
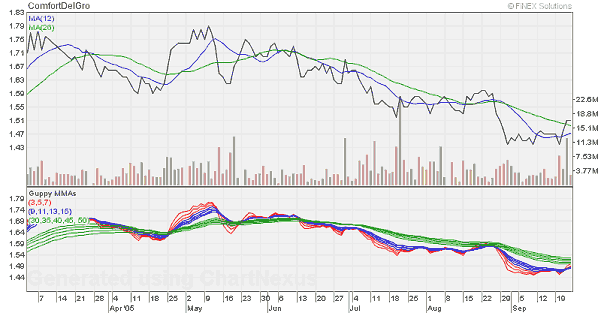
GMMA plots multiple short-term simple MA (e.g. 3-day MA, 5-day MA and 7-day MA) with multiple medium-term simple MA (e.g. 9-day MA, 11-day MA, 13-day MA and 14-day MA), and multiple long-term simple MA (e.g. 30-day MA, 35-day MA, 40-day MA, 45-day MA and 50-day MA). Example is shown in the chart above.
MA Envelope
MA Envelope is based on the principle that stock prices fluctuate around a given trend in cyclical movements of reasonable similar proportion (Pring 1985). In other words, just as MA serves as an important juncture point, so do certain lines drawn parallel to that MA (an envelope). The envelope consists of the points of maximum and minimum divergence from the center of the trend.
There is no fixed rule about the exact position at which the envelope should be drawn, since it can only be discovered on a trial-and-error basis with regard to the volatility of the index being monitored and the time span of the MA.
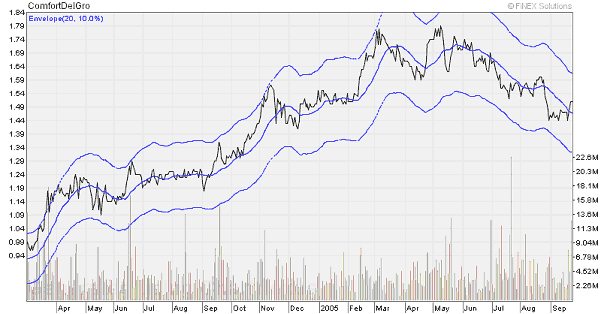
Below is an example of MA Envelope. In this example, MA Envelope is plotted at 10% intervals of the 20-day MA, i.e. at 18-day and 20-day MA.
How to interpret
Support and Resistance Levels
Since MA is a smoothed version of a trend, the average itself becomes an area of support and resistance. In a rising market, stock prices often finds support at the MA level and turns up. Similarly, a rally in declining market often meets resistance at MA and turns down (Pring 1985).
Trend Reversal
Changes in the trend of the stock being measured are identified not by a change in the direction of the MA, but by a crossover of the MA by the index itself. A change from a rising to a declining market is signaled when prices move below its MA. In similar fashion, a change from a declining to a rising market is signaled when prices move above its MA.
If the cross-above or cross-below occurs while MA is flat or has already changed direction, it is a fairly conclusive proof that the previous trend has been reversed.
If the cross-above or cross-below occurs while MA is still proceeding in the direction of the prevailing trend, this development should be treated as a preliminary warning that a trend reversal has taken place. Confirmation should await a flattening or a change in direction in the MA itself or should be sought from alternative technical indicators.
The above interpretation is the interpretation of a simple MA. In the case of a more sensitive weighted MA or exponential MA, a warning of a trend reversal is given by a change in direction of the average rather than a crossover.
For Dual MA, a bullish signal is given when the shorter-term MA moves above the longer-term MA. In the same vein, a bearish signal occurs when the shorter-term MA moves below the longer-term MA.
In GMMA, a strong bullish signal is given when the short-term MA moves above the medium-term MA and the medium-term MA moves above the long-term MA. A strong bearish signal is when the short-term MA moves below the medium-term MA and the medium-term MA moves below the long-term MA.
Another way to identify a turning point is by looking at the MA envelope. The movements outside the envelopes would be seen as overextended.
Example
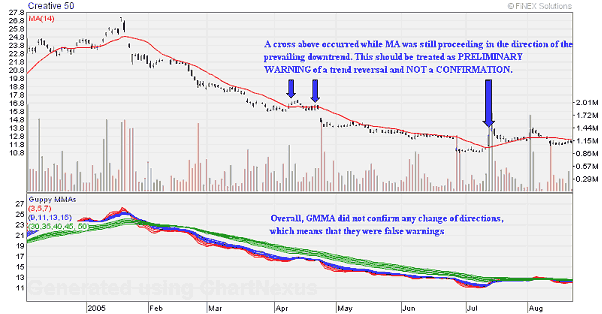
Creative experienced several cross-above its downtrend MA. Notice that in general, GMMA did not confirm any change of directions, which means that the cross-above signals were false signals.
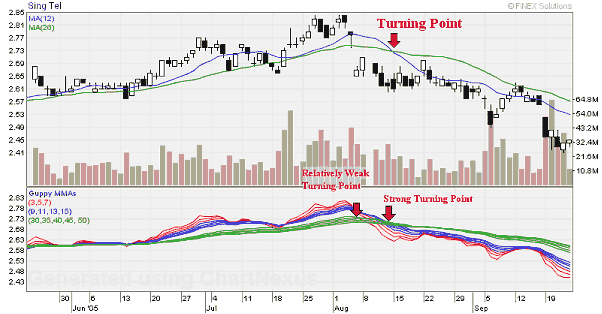
Singtel was generally experiencing an upward movement since September 2004 (except between end of March and mid May, where it experienced short-term price weaknesses). On 5 August 2005, the price made a sudden drop and short-term GMMA moved below medium-term GMMA. However, looking at Dual MA, the shorter-term MA (MA(12)) had not crossed below the longer-term MA (MA(26)). On 15 August 2005, MA(12) finally crossed below the MA(26). This was followed by a strong bearish signal of the GMMA, which confirmed the trend reversal.
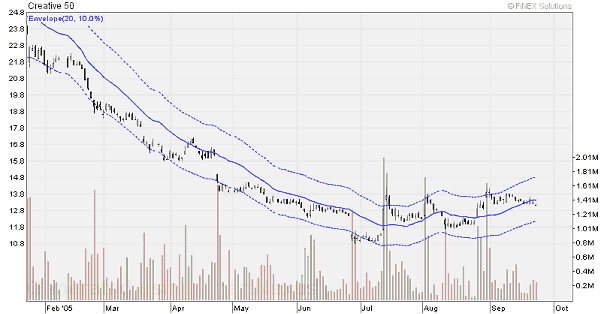
The chart for Creative shows 10% envelopes placed around a 20-day MA. Notice that during the downtrend, the upper envelope was almost never touched, while the lower envelope was touched repeatedly. Moves outside of the envelopes were seen as overextended and were significant for short-term traders who are more concerned with smaller price fluctuations.
References :
- Pring, M. J., Technical Analysis Explained: The Successful Investor's Guide to Spotting Investment Trends and Turning Points, 3rd Edition, 1991