Candlestick formation
Overview
Candle charts originated in Japan several centuries ago, but have recently gained a following in other countries. Candle charts can be plotted only for markets in the opening, closing, high, and low intra-day prices are known. Candles can be used to identify price patterns as well as to construct trendline (Pring 2002).
Structure of a candle
A typical candle consists of two parts: the real body, that is, the rectangular part, and the shadow or wick, that is, the two vertical extensions. The tops and bottoms of the rectangle are determined by the opening and closing prices for the day. If the closing price ends up above the opening price, it is plotted in white. When it closes below the opening price, it is plotted in black (see Figure 1). The thin, vertical shadow lines that protrude from the real body reflect the high and low for the day.
Since the closing and opening prices can be identical, or identical with the intra-day high or low, there are a number of possible combinations that need to be represented. Some of them are shown in Figure 2.
Identifying Short-Term Reversal
 |
Hammers and Hanging Men (Takuri and Kubitsuri)A hammer is an umbrella line that develops after a market decline. The color of the body is not important. A hammer is a bullish signal. In effect, it represents the kind of trading day when the price temporarily slips quite sharply, because there is a run on the selling stops. Nevertheless, the technical position is sufficiently constructive to cause buyers to come into the market and push the price back up toward or above the opening level. A hanging man is identical to a hammer, but occurs after a rally. A hanging man is a bearish signal. If a hanging man appears after a prolonged upmove, it should be treated with respect, especially if it occurs after a gap (Pring 2002). |
 |
Dark Cloud Cover (Kabuse)A dark cloud candlestick formation consists of 2 days. The first is a strong, white real body, and the second is a black body, in which the close occurs in the lower half of the previous white real body. Its bearish connotations are most pronounced during an uptrend or in the upper part of a congestion zone (Pring 2002). |
 |
Piercing Line (Kirikorni)It is also known as "sunny sky" because it is the exact opposite of the dark cloud and is therefore bullish. The signal is more pronounced during a downtrend or in the lower part of a congestion zone. It is important to note whether the second day's white body closes more than halfway above the previous black body. If it does not, conventional wisdom indicates that additional weakness is likely (Pring 2002). |
 |
Engulfing Pattern (Tsutsumi)This formation develops significance after a prolonged price move (Pring 2002). A bullish engulfing pattern occurs when prices open lower than the previous day's close and then rally to close above the previous day's open. Thus, the current day's white real body "engulfs" the prior day's black real body. Note that only the real body is important in this pattern; both upper and lower shadows (i.e. vertical lines) are ignored. Bearish engulfing pattern is the opposite of the bullish engulfing pattern. |
 |
Morning StarThe morning star heralds a new day (upmove) and is bullish. It consists of two long real bodies separated by a spinning top; altogether develop over three periods. In the first period, prices close lower than they opened, resulting in a black main body. The star is represented by a spinning top, which is made on a downside gap in the second period. The third period's body should be white and should has a closing price above the midpoint of the first period's black body (Meyers 1994, Pring 2002). |
 |
Evening StarThe evening star is a precursor of night. It has the opposite characteristics and implications of a morning star (Pring 2002). Evening star has a white body in the first period. In the second period, price opens higher, creating an upside gap and close lower after trading in a relatively narrow range (i.e. a spinning top). Finally, in the third period, price continues to move lower and close below the midpoint of the first period's white main body (Meyers 1994). |
 |
Doji StarA doji star is a bearish sign and occurs after a lengthy rally (Pring 2002). It occurs when price gap to the upside on the open, and then close at the same price as the opening price (Meyers 1994). |
 |
Shooting StarA shooting star is like a short-term top where the daily price action experiences a small gap and the black real body appears at the end of a long wick or upper shadows (Pring 2002). |
 |
Upside Gap Two Crows (Narabi Kuro)This bearish formation consists of a long white body followed by two black bodies. The first black body gaps to the upside of the long white body. The third black body often closes the gap (Pring 2002). |
Three Black Crows (Samba Garasu)
The three black crows pattern consists of three declining black candlesticks that form after an advance. They indicate lower prices. Each black candles should open within the real body of its black predecessor and close at or close to its session low (Pring 2002).
Tweezer Tops and Bottoms (Kenuki)
A tweezer top consists of two candles with an identical high. Actually, it is possible for a tweezer to consist of more than 2 days with an identical high. This pattern is short-term bearish because the first day's high acts as resistance; when the second day is unable to break through the first day's high, it indicates a loss of upside momentum.
A tweezer bottom occurs when, after a decline, two or more candles make an identical low. This is a short-term bullish, indicating a loss of downside momentum since the price finds support in the area of the low.
One factor that will increase the significance of a tweezer is the nature of the pattern being formed, e.g. engulfing pattern, hammer, hanging man, etc (Pring 2002).
 |
Belt-Hold Lines (Yorikiri)A bullish belt-hold is a one candle pattern consisting of a long candle in which the price opens on the intra-day low and then works its way higher throughout the session. The price does not have to close at the high, but the longer the real body, the more positive the candle. Also, if a belt-hold has not appeared on the chart for quite a while, it is therefore an unusual phenomenon. As a result, it gains in importance. This is because traders are making a very strong statement about their feelings towards the market with a belt-hold compared to the smaller candles that were previously a norm. Just think of a crowd murmuring, and then a loud voice comes from within the crowd. It is obviously a person who wants to be heard. The belt-hold following a long period of smaller candles amounts to the same thing. It is a one-day pattern that says loudly, "Listen to me because I am telling you, the short-term trend has changed" (Pring 2002). A bearish belt-hold is the opposite. |
 |
Counterattack or Meeting Lines (Deai Sen/Gyakushu Sen)A bullish counterattack develops when, after a decline, a black candle is followed by a white candle and both close or "meet" at the same level. The first day is usually a long black candle. The second day opens sharply lower, leading most traders to believe prices will continue to give way. However, by the end of the day, the price has regained everything lost (a counterattack by the buyers) and closes unchanged. The meeting line therefore indicates that the downside momentum has probably dissipated and a reversal in trend is likely (Pring 2002). A bearish counterattack or meeting line is formed when after an advance, a white candle is followed by a black candle and both close at the same level (Pring 2002). More specific rules for identifying these patterns are as follows:
|
Identifying Continuation Formations
 |
Upside Gap (Tasuki)A tasuki gap occurs after an advance (Pring 2002). An upside tasuki gap pattern develops over three periods. In the first period, price closes above its opening price, resulting in a white real body. In the second period, price gaps to the upside on the open and then close higher, creating a white real body. In the third period, price opens within the real body of the second period and then close lower, but do not fill the gap (with either the real body or the lower shadow). This suggests that only a temporary setback has occurred and that prices will continue higher (in essence, because the gap has acted as a support level) (Meyers 1994). |
 |
Windows (Ku)Japanese chartists refer to gaps (areas on a chart where no actual trading takes place) as windows. Windows therefore have the same technical implications as gaps (Pring 2002). Gaps frequently act as support or resistance. An upside window is considered to be bullish, while a downside window is viewed as bearish. |
 |
Harami Lines (Yose)Harami formation is similar to the consolidation trendline break in that it indicates a loss of momentum. The main difference is that harami lines are of much shorter duration and consist of 2 days' price action. The second one, the harami, forms a real body that is sufficiently small to be engulfed by the prior day's long real body. If the harami is also a doji, it is called harami cross (Pring 2002). After a sharp rally or reactions, these patterns indicate a balance between buyers and sellers after one or the other has predominated. This means that harami often warn of an impending trend change. In some instances, this will be from up or down to sideways and in others an actual reversal (Pring 2002). |
Tweezer Tops and Bottoms (Kenuki)
These formations are very similar in concept to a flag formation, except that they take only a few days, not weeks, to develop. The rising three method is a bullish pattern and consists of a powerful white body followed by a series of three or four declining small black bodies. These bodies should be accompanied by a noticeable contraction in volume that a very fine balance is developing between buyers and sellers. The final part of the pattern is a very strong white body that takes the price to a new closing high. This final day should record a significant increase in activity (Pring 2002).
The bearish falling three method is exactly the opposite except that volume characteristics are of no significance on the last day (Pring 2002).
Example
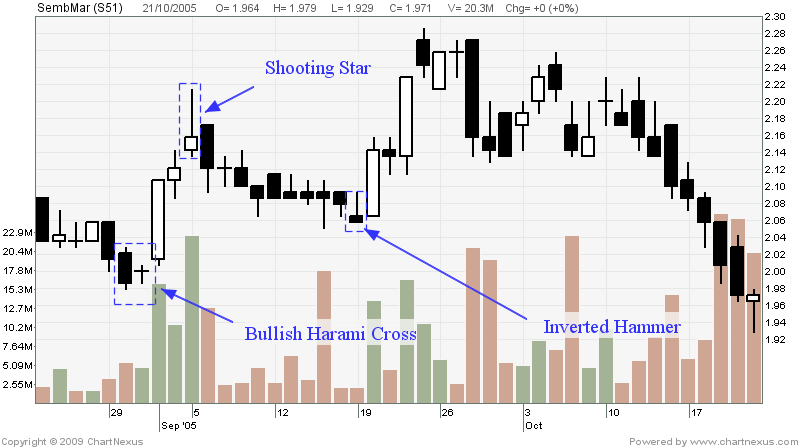
After a retracement, SembMar exhibited a Bullish Harami Cross pattern. This signaled a possible short-term reversal. However, on the third day after the shooting star was formed, the prices then started to decline. During the downward price movement, an inverted hammer was observed which signaled a possible trend reversal.
References :
- Meyers, T. A., The Technical Analysis Course: A Winning Program for Investors and Traders, 1994
- Pring, M. J., Technical Analysis Explained, 2002